
What's New
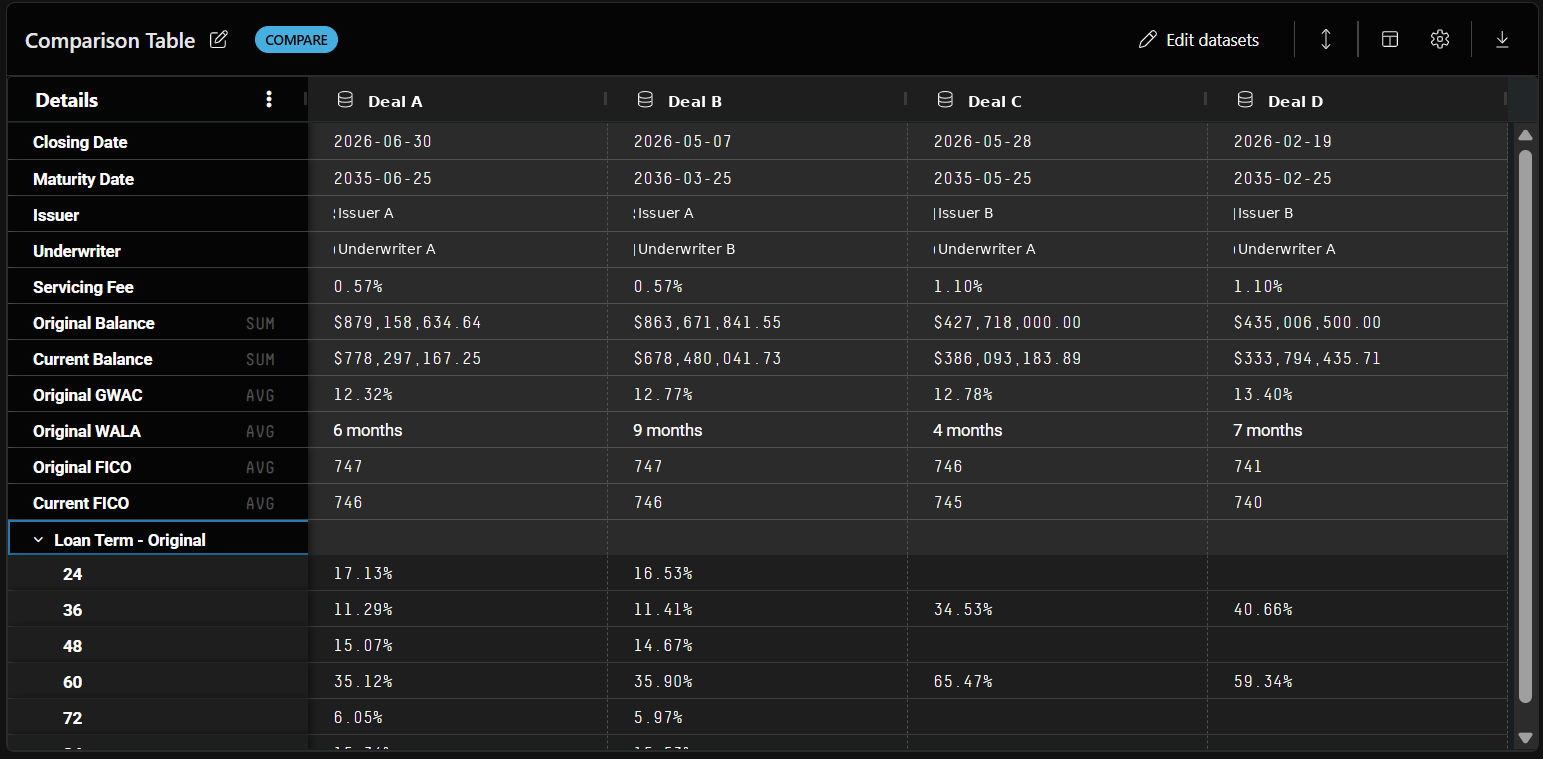
You can now compare multiple deals and loan tapes side by side in a single table on the Reports page. Deal Compare turns each dataset you select into a column and lays deal details and collateral stratifications out as rows, so you can size up a new pool against prior deals without exporting to Excel or flipping between pages.
Feature Highlights
- Mix deals and tapes in one view: compare a tape you just uploaded against issued deals, or compare deals against each other. Column icons make it clear which is which at a glance.
- Control exactly what you show: use Edit Rows to trim the comparison to the metrics that matter, and override bucketing on any stratification row.
- Export the comparison: send the table straight to Excel or PDF, reflecting whatever rows you have chosen to display.
- Save and reuse it: Deal Compare tables are supported in Saved Views, so a comparison you build once comes back configured the way you left it.
Who This Is For
Investors, issuers, and analysts evaluating pools across deals — anyone whose current workflow involves pulling the same strats for several deals and lining them up manually.
Why It Matters
Comparing collateral across deals has meant running the same report several times and stitching the results together outside the app. Deal Compare removes that step: pick your datasets, choose your rows, and read the differences directly. Because the comparison saves as a view and exports in one click, a pool screen you build once becomes a repeatable part of your process rather than a one-off exercise.
Deal Compare covers deal details and collateral metrics. Performance metrics such as delinquency, CDR, CPR, and losses are not included — see the full Help Center article for details.